Rowing Pace Chart
One split, every distance, plotted against the training zones. Screenshot it, print it, paste it onto the boathouse whiteboard. Updated live as you type.
Last updated:
What is a rowing pace chart?
A rowing pace chart maps your 500m split to predicted times across every common rowing distance, banded by training zone. Pick an anchor split and the chart shows your projected 2k, 5k, 6k, 10k, half marathon, and marathon. The bands shade UT2 through AN so a coach can read off zone splits at a glance. Useful for Henley 2k pacing, head race target splits, and long winter UT2 sessions.
Anchor 500m split from your 2k
Predicted 500m split across distances
Take it with you
Screenshot or print the chart and stick it on the boathouse whiteboard. The chart is inline SVG so it scales perfectly at any size. Need this for every rower in the squad? That's exactly what the Row HQ coach dashboard does.
How do you read a rowing pace chart?
Read across from the average 500m split to your chosen distance. The finish time assumes the same split throughout the piece. This static rowing pace chart gives quick reference values even before the interactive chart loads. The training zones and distance predictions above answer different questions from a constant-pace conversion.
Your indoor rower displays a 500m split, even during a longer piece. Follow the row for that 500m split to compare finish times. For an exact split time between rows, use the pace calculator. The watts converter shows the power output behind your split time. Indoor rowing predictions above the table use a separate endurance model.
| 500m split | 1,000m | 2,000m | 6,000m | 10,000m |
|---|---|---|---|---|
| 1:45 | 3:30 | 7:00 | 21:00 | 35:00 |
| 1:50 | 3:40 | 7:20 | 22:00 | 36:40 |
| 2:00 | 4:00 | 8:00 | 24:00 | 40:00 |
| 2:15 | 4:30 | 9:00 | 27:00 | 45:00 |
A pace chart does not account for endurance, starts, rest intervals or a finishing sprint. Use the performance monitor average split for a completed session. Do not average several split times equally when the distances differ.
Enter an exact distance and total time in the erg pace calculator when your result falls between these rows.
For a target based on a different test distance, use the 2k prediction calculator instead of reading a same-pace finish time as a prediction.
Compare the power output behind each row with the watts to split converter to see why equal pace gains require unequal extra watts.
Method and further reading: Concept2 indoor rower pace chart
Frequently asked questions
How does the chart predict a 500m split across distances?
It uses T2 = T1 x (D2 / D1)^1.06 to estimate a finish time, then converts that to a 500m split. The exponent is an assumption. There is no guaranteed error margin, so compare the predicted split time with completed tests.
What do the shaded bands mean?
They show illustrative training zones using offsets from your 2k 500m split. UT2 is 12-16 seconds slower, UT1 6-10 slower, AT 3-5 slower, TR near 2k pace and AN 3-5 faster. Use effort and coaching advice to adjust the suggested pace.
Can I print the chart and reference table?
Yes. Use your browser print command or take a screenshot. The interactive chart shows distance predictions, while the static table compares equal-pace finish times. The watts converter gives the power output behind an average split.
How to read the pace chart
The line shows an estimated 500m split at each distance
The curve applies a Riegel exponent of 1.06 to your anchor result. A longer distance therefore has a slower predicted 500m split. The curve describes the model, not a measured change in your physiology. Compare its split time with completed tests before using a prediction as a target.
The coloured bands are the training zones
The shaded bands use fixed offsets from your 2k 500m split. UT2 and UT1 represent easier aerobic work; AT, TR and AN represent harder efforts. These are illustrative coaching ranges. A line crossing a band does not prove your lactate threshold or the correct pace for a particular workout.
Why the Riegel curve matters
The Riegel equation T2 = T1 x (D2 / D1)^1.06 estimates time at a new distance from a completed result. It assumes a particular relationship between distance and sustainable pace. Do not apply automatic corrections for age or body weight: individual endurance and test conditions affect the result.
How coaches use this chart in practice
Use the chart to compare possible targets and review them after a real test. Keep the same machine setup and record your average split. If the result differs from the prediction, review pacing, effort and conditions with your coach. The chart cannot diagnose a fitness or equipment problem.
The chart pairs well with the 2k prediction calculator for estimating times you have not raced yet, and the training pace calculator for turning one score into zone targets. Racing a 2k soon? Read the 2k pacing strategy guide first.
From the RowHQ shop
Printable PDFs written for club rowers. Buy once, keep forever.
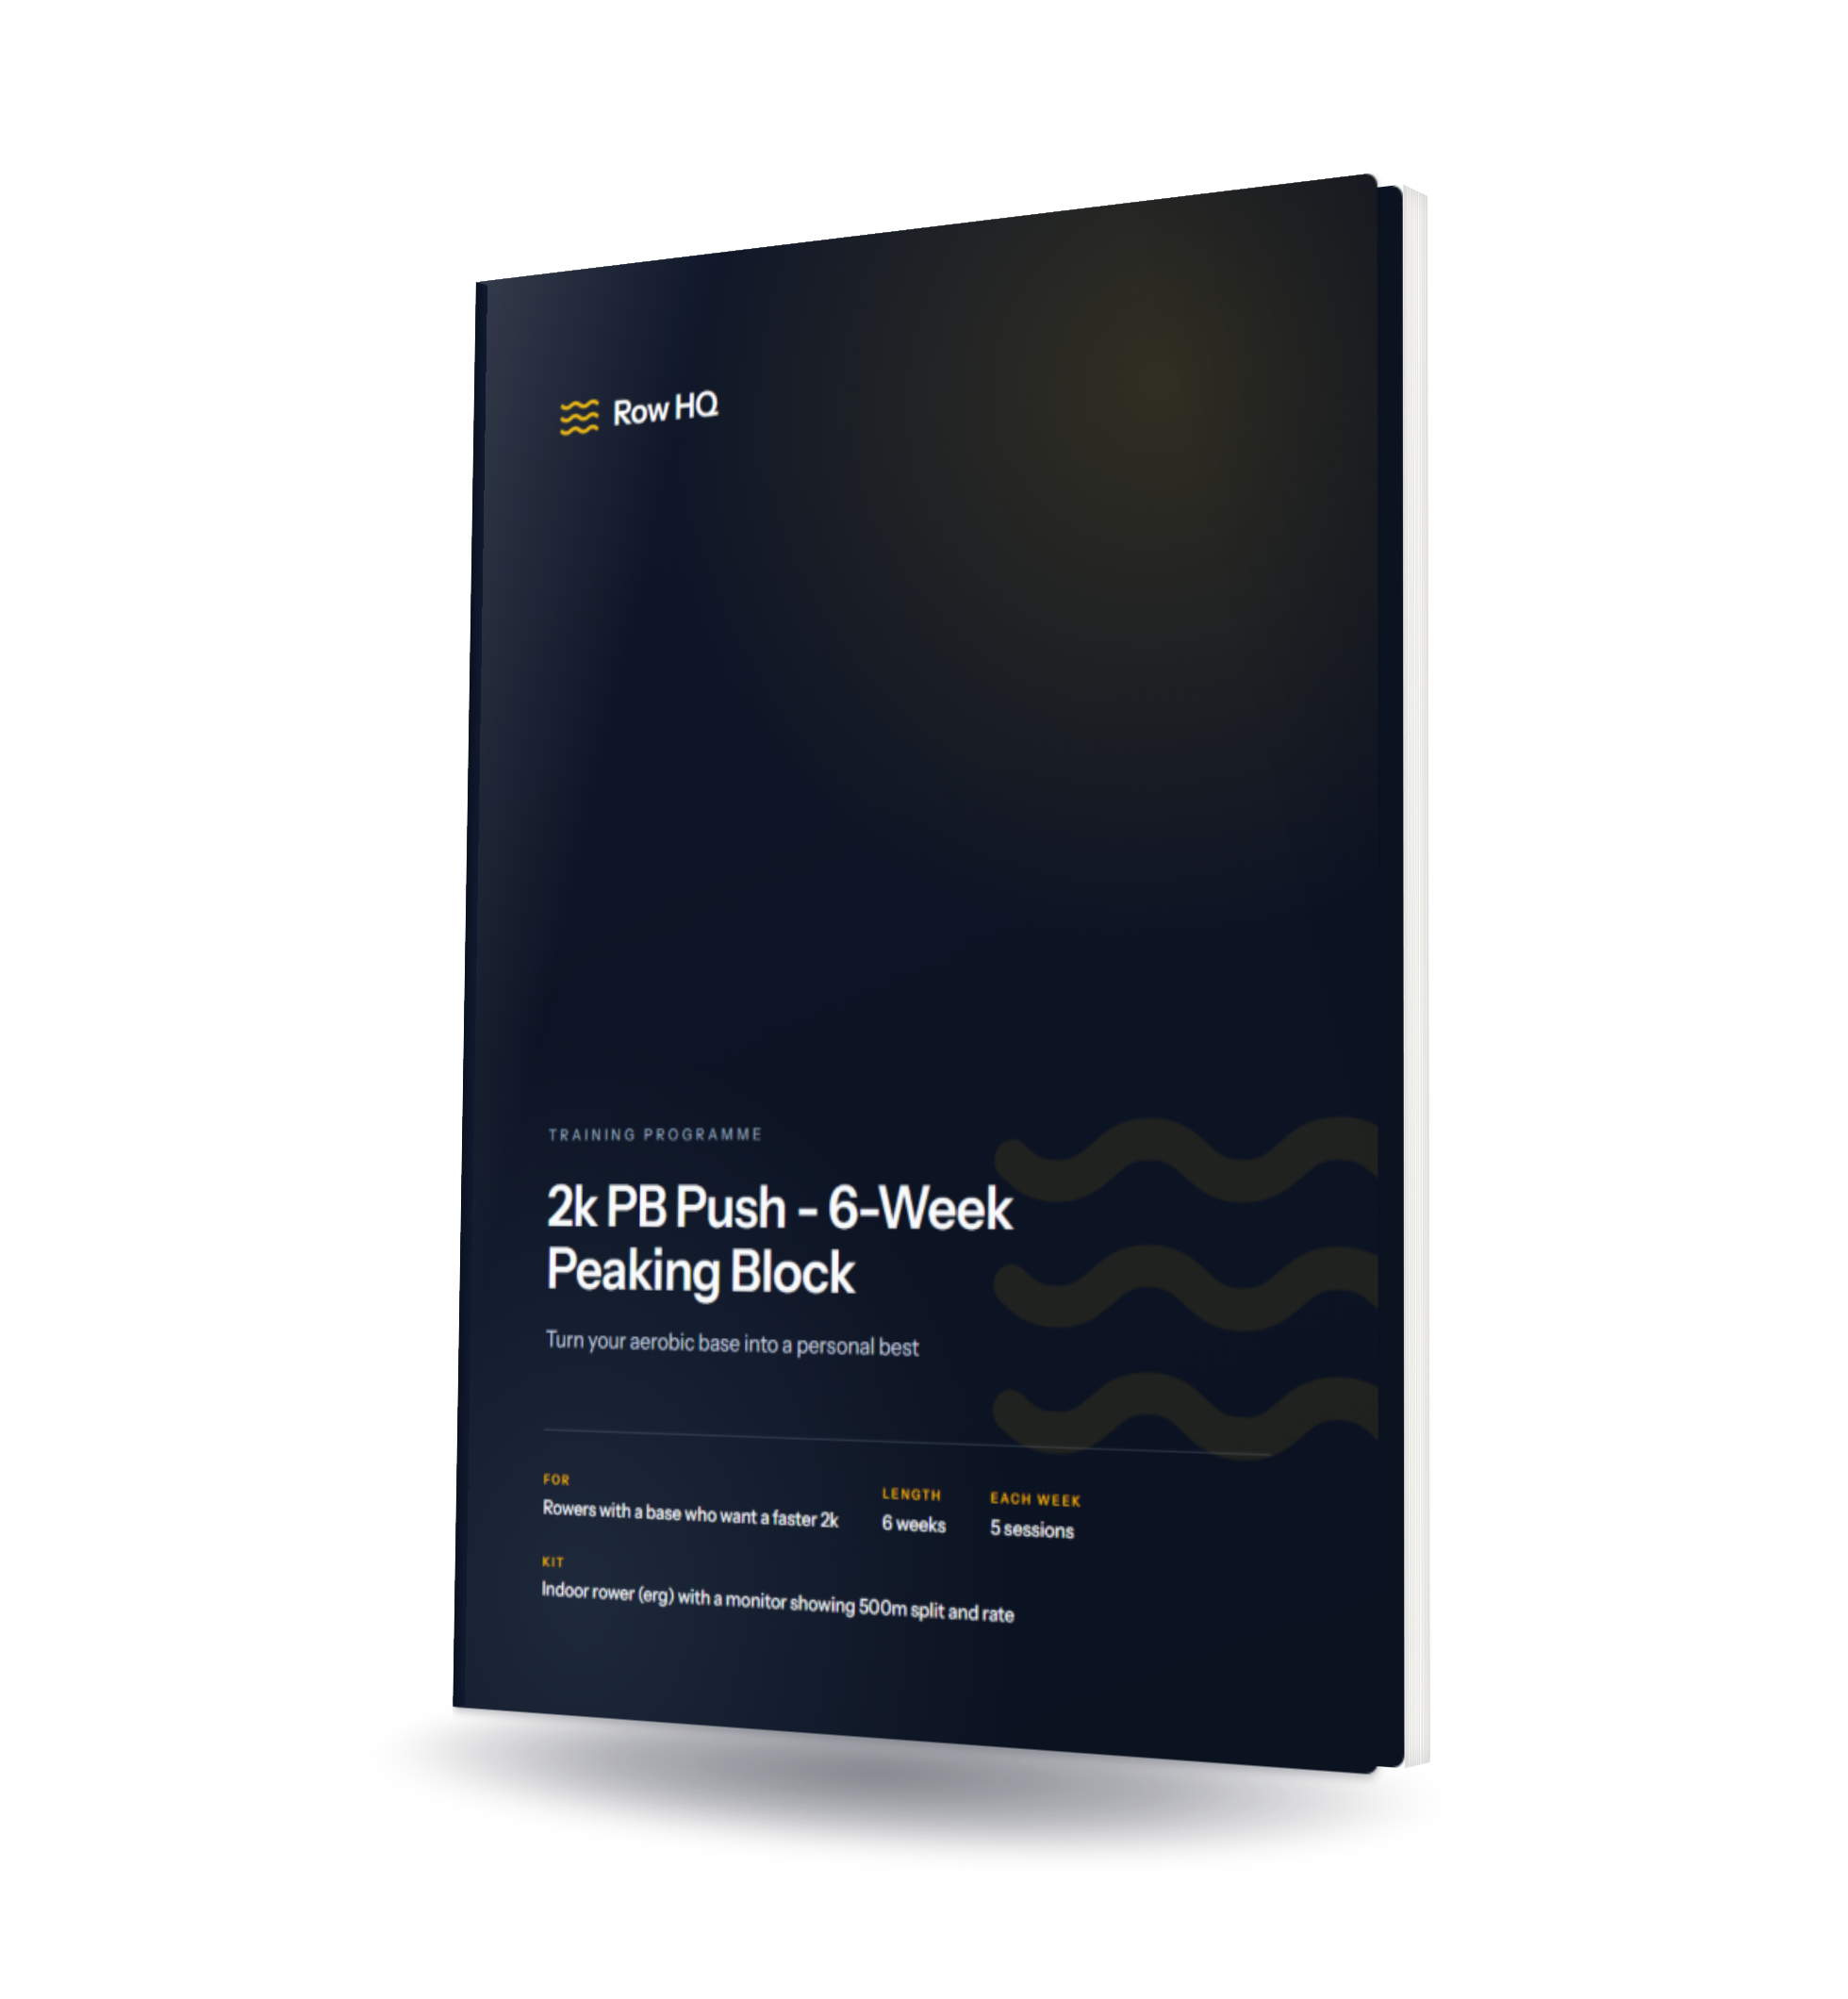
2k PB Push - 6-Week Peaking Block
Six weeks that turn an existing aerobic base into a 2k personal best - race-specific work, a proper taper, every pace scaled to your own time.
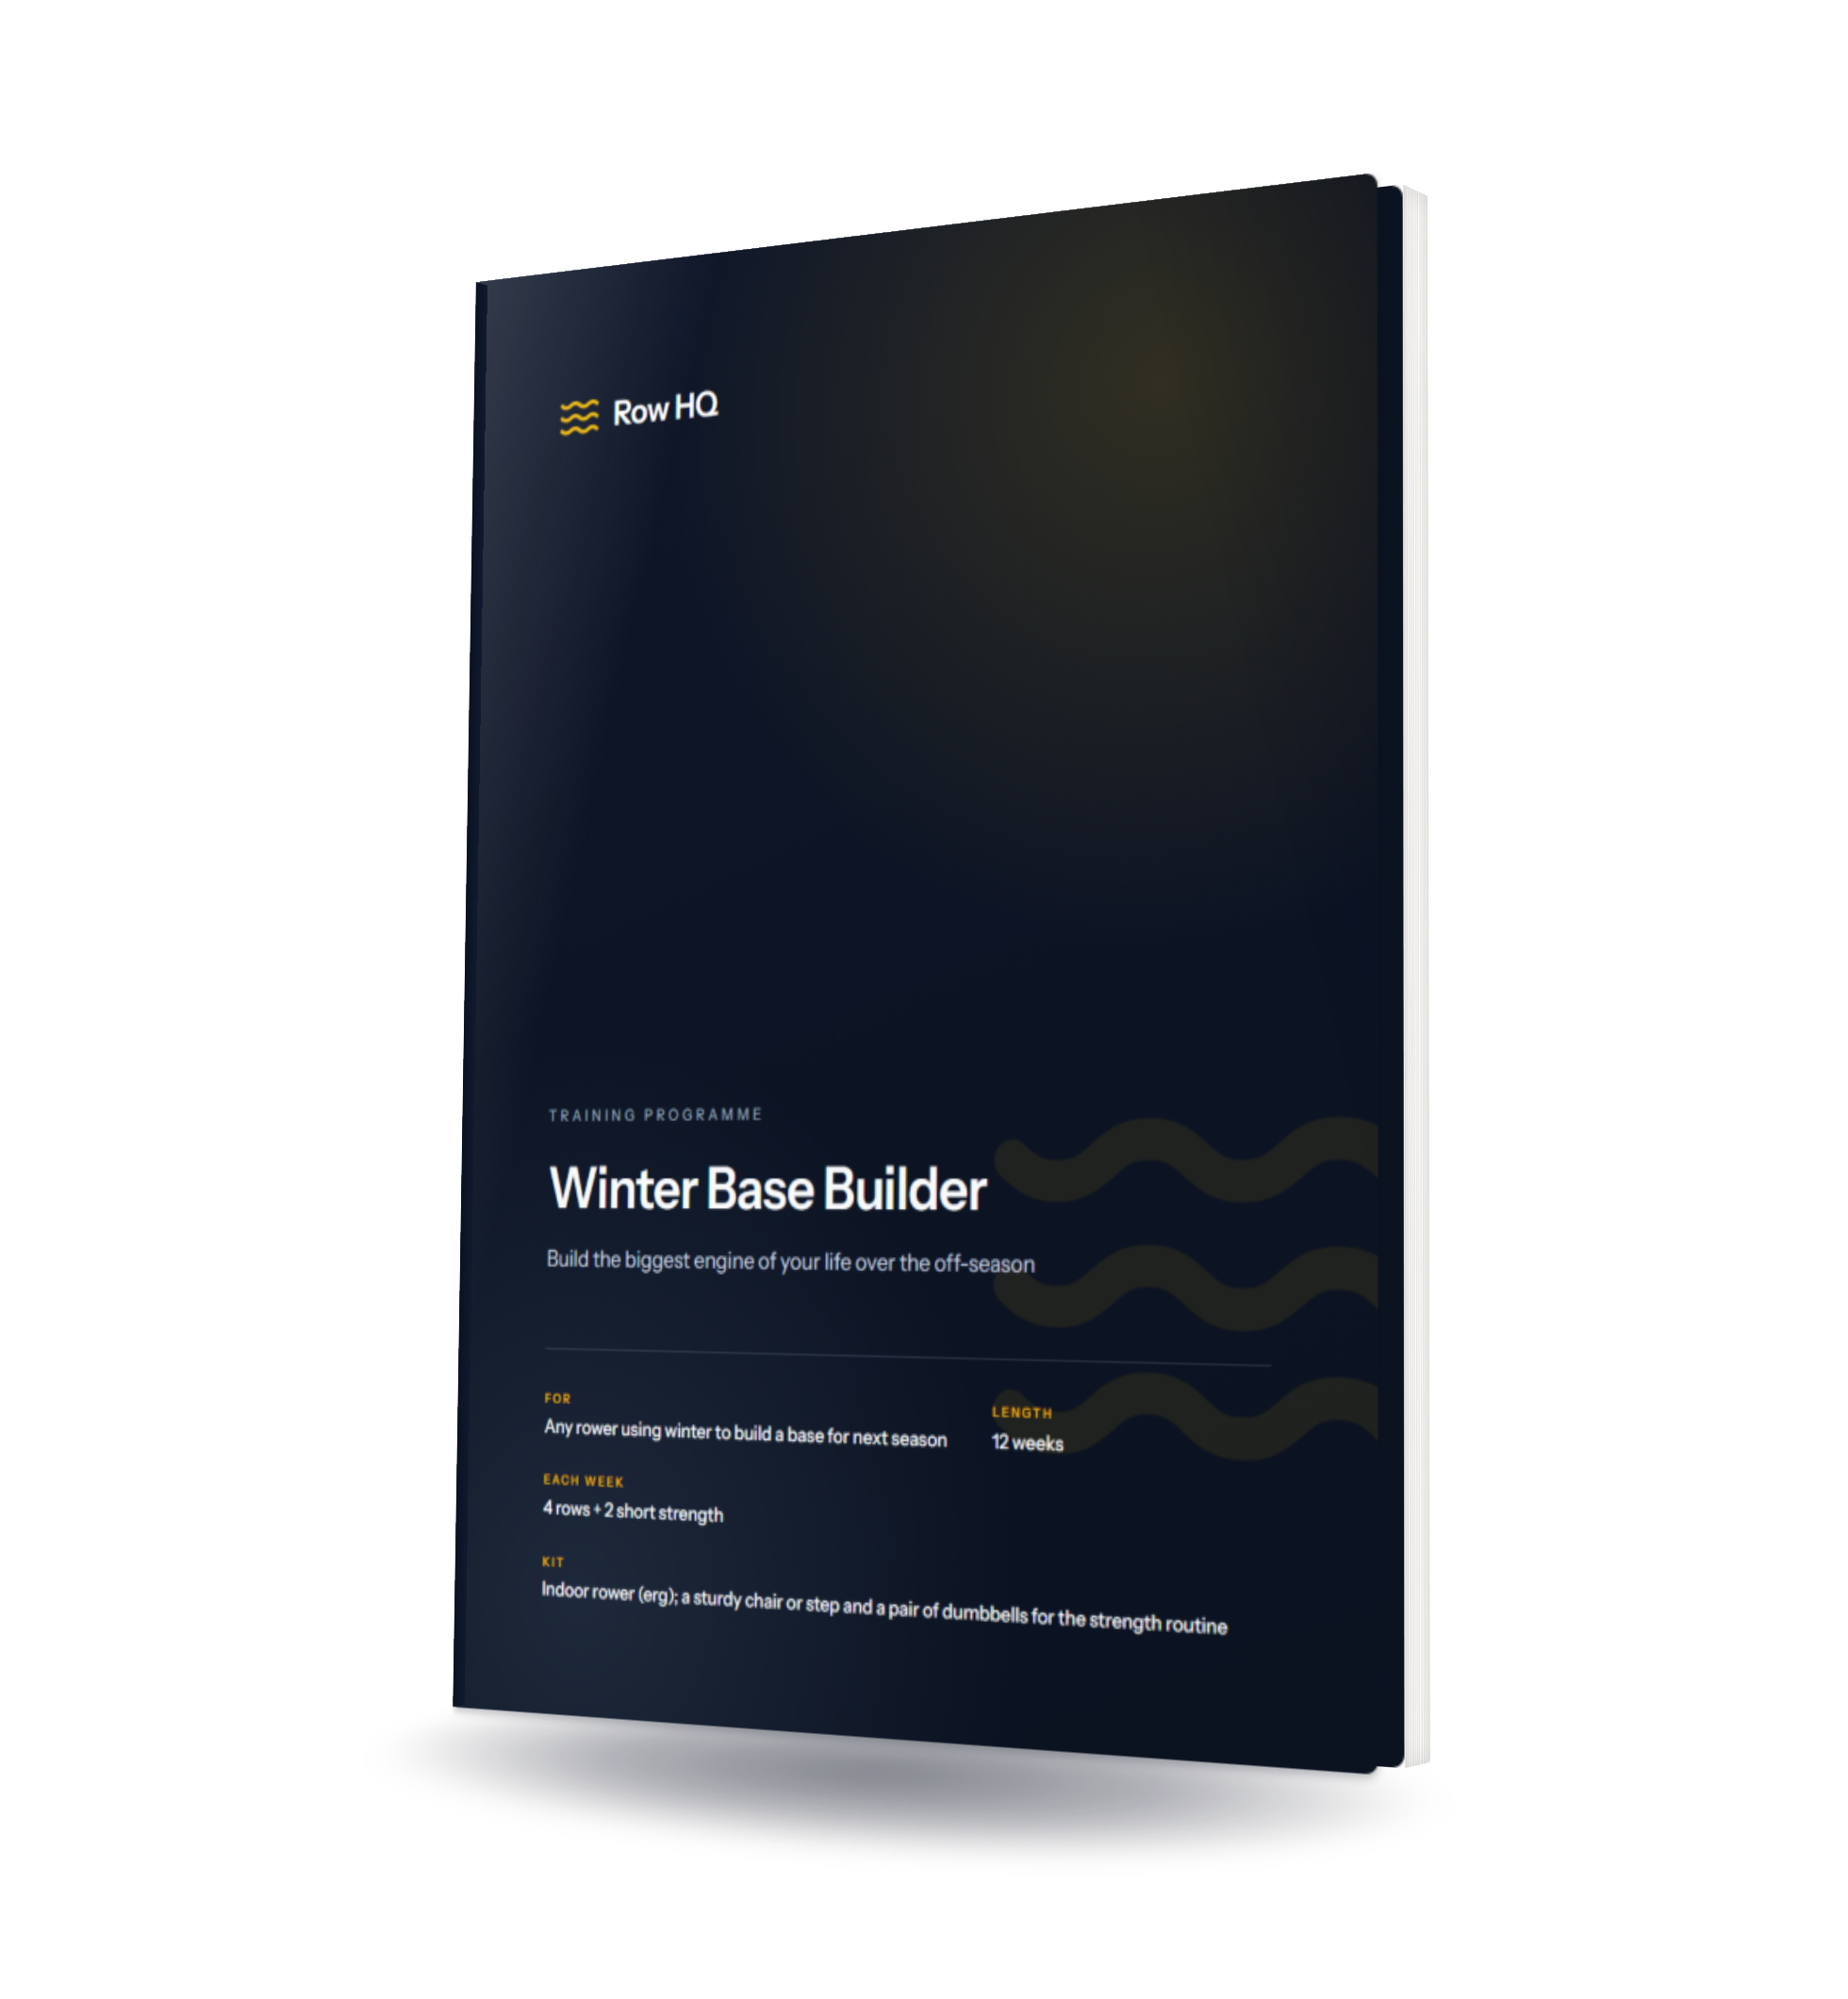
Winter Base Builder
Build the biggest engine of your life over the off-season - 12 weeks of mostly-easy volume plus a strength routine, so you arrive at spring fast.

The Club Session Library
52 rowing sessions for club coaches, with an illustrated coaching PDF, editable CSV plans, two seasonal blocks and a printable coaching cheat sheet.
One chart per rower? Sure. Twenty-five charts every Monday? That's Row HQ.
Generating one pace chart is fine. Generating one for every athlete every Monday morning, anchored to their latest test, is a database job. Row HQ produces zone-banded splits per rower automatically and keeps the history so you can see whether the chart is moving the right way across a season. See it in coach tools, inside training session tracking, or in how Oundle Town RC uses it.