The honest answer in 30 seconds
Four ergo numbers are worth chasing at club level: 2k time, 500m split, watts and stroke rate. Run a monthly 2k on a Concept2 RowErg at a fixed drag factor (110 to 130 for most senior athletes), log every test with body weight and a one-line note, and pull the trend across the season. British Rowing's PT Testing Protocols (2022) specify Concept2 in every fitness test, so your numbers stack against national benchmarks. Everything else on the PM5 is noise once you have those four.
Every serious rowing programme uses ergometer testing to benchmark fitness, track progress and identify potential. It works at club level too. With the right tools and a consistent approach, your club can use ergo data to track athlete progress and make better training decisions.
Why ergo testing matters
The ergometer strips out everything that can affect on-water times: weather, equipment, the crew you happen to be in. Ergo scores give a clean measure of individual fitness and power output. Regular ergo testing does three jobs:
-
Benchmarking: Establish baseline fitness levels and compare athletes objectively for crew selection and training group placement.
-
Progress tracking: Monitor improvement over weeks, months and seasons to validate training effectiveness and adjust programmes as needed.
-
Goal setting: Give athletes specific, measurable targets to work toward. "Get fitter" becomes "break 7:30 on the 2k by March."
A quick sense of how big the data set is. In 2025 alone, the Concept2 Logbook recorded:
The four metrics that matter
Not every number on the screen is worth chasing. Knowing which metrics to track and what they actually mean is the difference between data-driven training and noise. The four to watch, all read straight off the Concept2 PM5 (the monitor the entire UK club system runs on - see our ergometer glossary entry):
Key ergo metrics explained
2k time
The gold-standard benchmark. A 2,000m test measures peak aerobic capacity and mental toughness. Track times to the second.
500m split
Average pace per 500m. Splits reveal pacing strategy, consistency and where athletes gain or lose time during a piece.
Watts
Raw power output. Watts give an objective measure of strength that can be compared across athletes and tracked over time.
Stroke rate
Strokes per minute (SPM). Pairing rate with split shows efficiency - the ability to move the boat fast with fewer strokes.
It's the best all-round fitness machine in the world, and suitable for anybody, not just international athletes. No matter how hard I tried, I could never beat it. It never broke and it never let me down.
How Row HQ makes ergo tracking easy
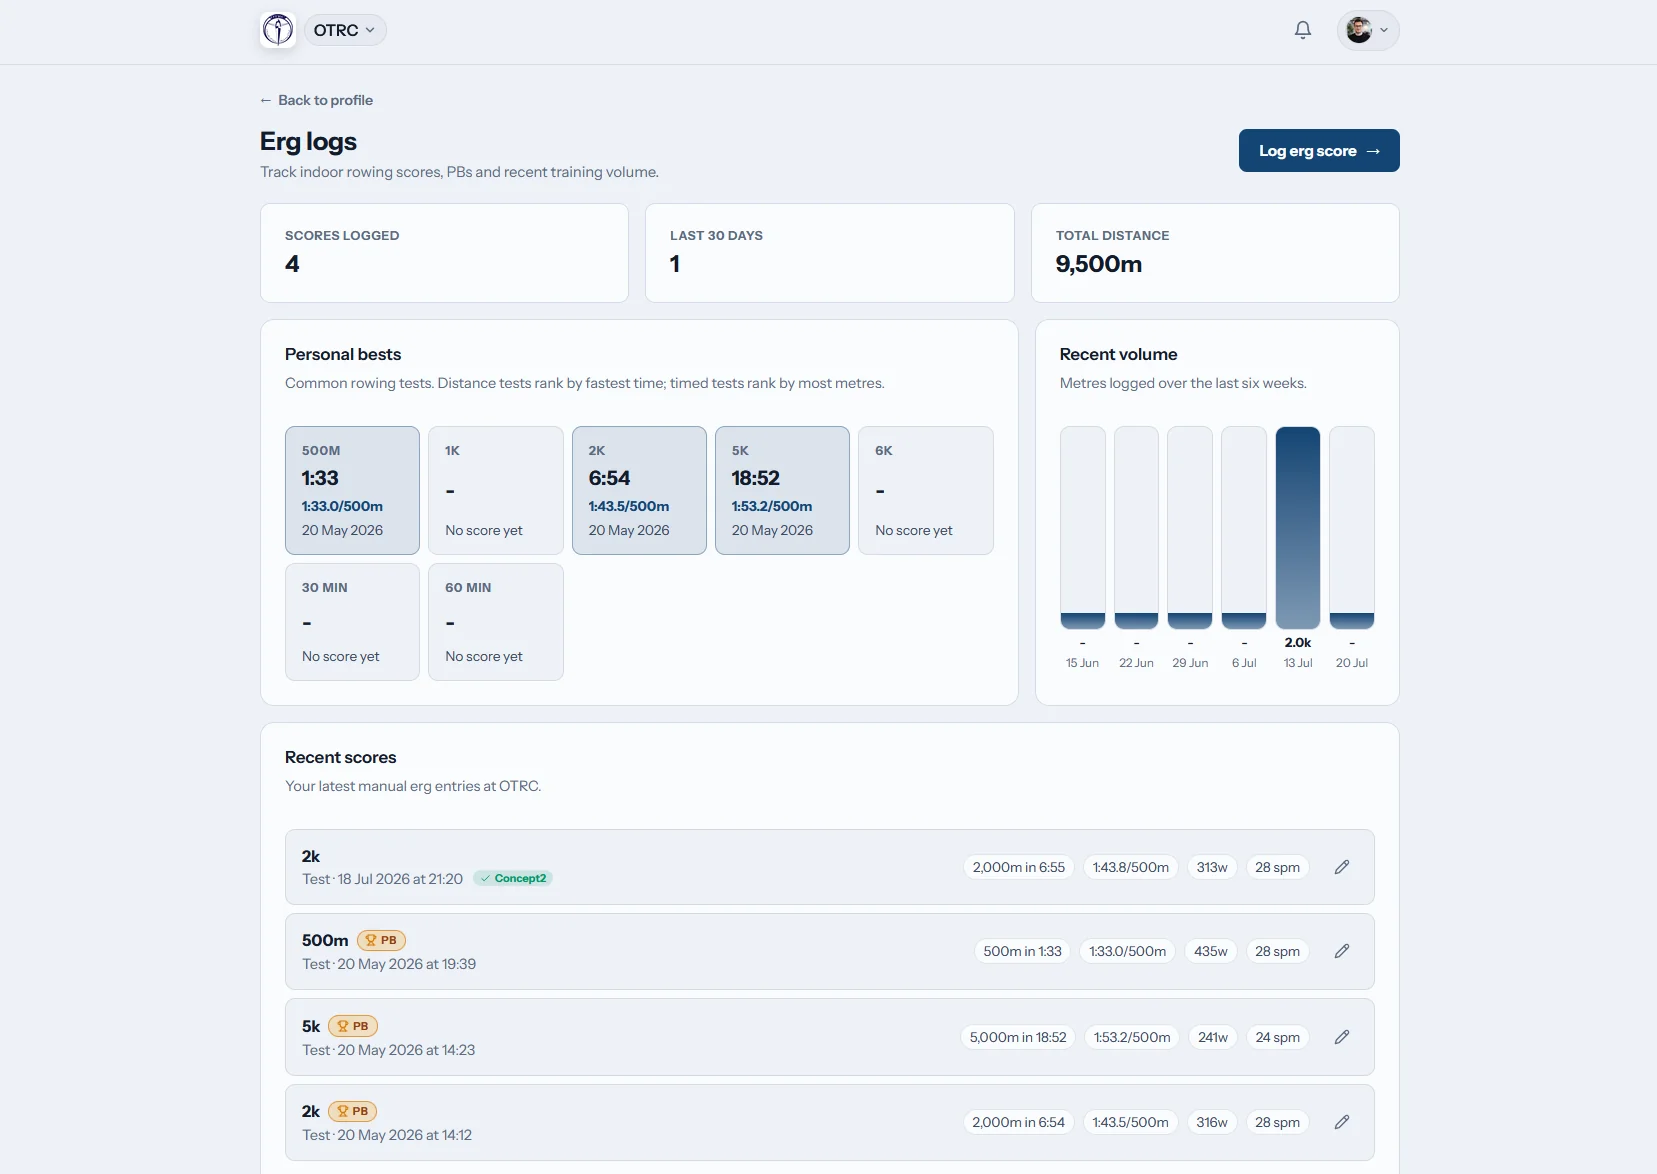
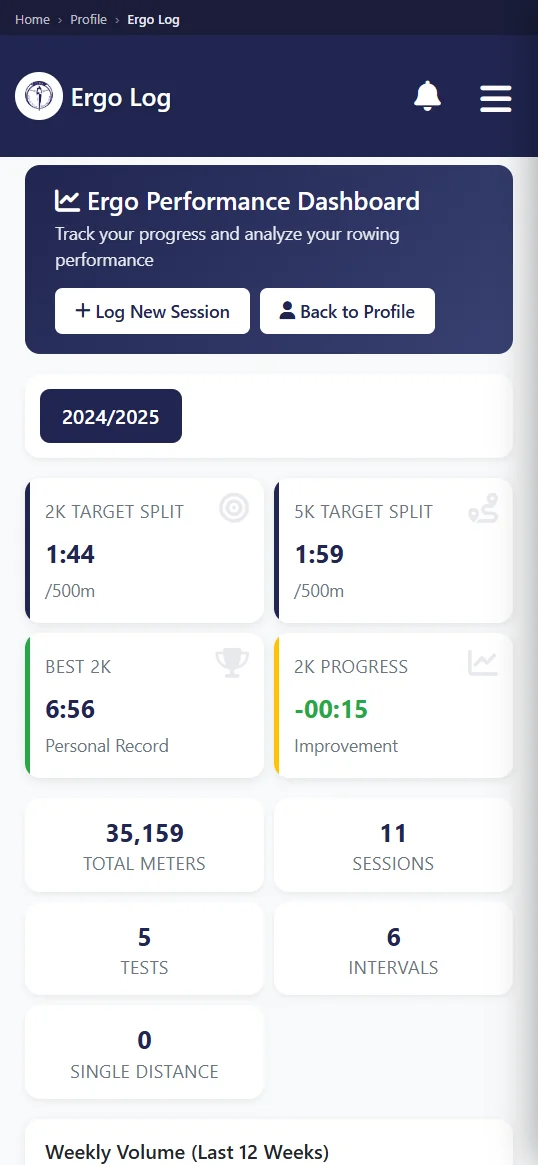
Collecting the data is the easy half. Organising it, comparing it across athletes and acting on it is where most clubs fall down. Row HQ's built-in ergo log, part of our coach tools, turns raw test scores into something coaches and athletes can actually use. Athletes upload Concept2 scores today via the member portal or CSV import; a direct Concept2 Logbook API sync is on our short-term roadmap so scores flow in automatically.
-
Easy logging: Athletes log their scores directly from their phone or computer via the member portal in seconds. No more paper sheets or spreadsheet nightmares.
-
Historical data: Every test is stored and instantly accessible. View trends over weeks, months or entire seasons to spot patterns and measure long-term progress.
-
Coach review: Coaches get a consolidated view of all athlete scores via the admin dashboard, making crew selection and training adjustments straightforward and data-backed.
-
Personal bests: The system automatically tracks PBs, celebrating achievements and giving athletes clear targets to beat. Athletes can view their PB history in the member portal.
Using data to motivate and improve
Numbers do not drive performance on their own. How you use them does. The patterns that work at club level:
- Celebrate progress: A 2-second improvement on a 2k is a real achievement. Recognise and reward improvements, not just top scores.
- Create healthy competition: Leaderboards and squad rankings tap into athletes' competitive drive and push everyone to improve. The training session tools tie this data back to on-water performance.
- Identify weaknesses: Consistent pacing issues? Low watts despite good technique? Data reveals specific areas to target in training sessions.
- Track training load: Correlate ergo performance with training volume to optimise periodisation and prevent overtraining.
Real progress: sample athlete journey
2k baseline
14s improvement
New PB
5.7% faster
Five tips for effective ergo testing
A useful ergo testing programme depends on consistency. Test conditions that drift introduce noise that makes your data harder to compare. The practices that keep results reliable:
- Standardise test conditions: Same time of day, same warm-up protocol, same drag factor. Variables introduce noise that makes comparisons unreliable. Use our drag factor calculator to set athletes up correctly per session.
- Test regularly: Monthly 2k tests give enough data points to track trends without over-testing. Add shorter tests (500m, 6k) for variety.
- Record everything: Beyond the final time, log splits, stroke rate, body weight and how the athlete felt. Context makes data more valuable.
- Create a supportive environment: Ergo tests are brutal. Build a culture where athletes push each other and recognise effort, not just the fastest score.
- Review and discuss: Schedule one-to-ones with athletes to review their data, set goals and create personalised training plans. Use a 2k prediction calculator to extrapolate from shorter test pieces.
When athletes can see their progress over time - not just feel it, but see it in black and white - it changes how they approach training. The numbers give them something concrete to push against. Coaches at Oundle Town Rowing Club found exactly this.
The bottom line
Ergo data does not replace coaching instinct. It backs it up. Objective numbers help coaches make better decisions through the coach tools, give athletes a clear picture of their progress, and make improvement visible across the squad.
Row HQ's ergo log does the recording and organising. No more lost spreadsheets or manual calculations. Just the numbers your coaches need, in one place. Need to crunch a single split? Use our free erg pace calculator to convert splits to watts, calories and predicted times across distances. Browse the screenshot gallery to see the ergo log in action, check our pricing, or get started today. Got questions? Visit the FAQ.
- The Row HQ Team
Sources & references
- PT Testing Protocols (November 2022 PDF) — British Rowing
- Crew selection in rowing (coach perspective on erg-test weighting) — British Rowing Plus
- Concept2 PM5 monitor service and reference — Concept2
- Concept2 Online Logbook — Concept2
- Concept2 2025 Year in Review (141,735 new athletes, 79.7B m logged, 210+ countries) — Concept2 (accessed May 17, 2026)
- New 2k world record 5:35.8 (Josh Dunkley-Smith) — Concept2
- Trends in indoor rowing records — World Rowing
- Why Sir Steve Redgrave uses the Concept2 rower — Fitness Etc
- Row HQ erg pace calculator (split to watts, calories, predicted times) — Row HQ
- Row HQ 2k prediction calculator (extrapolate from shorter pieces) — Row HQ
- Row HQ drag factor calculator (set athletes per-session) — Row HQ